PrometheusGrafanaDocker
Project Overview
This setup gives clear visibility, fast incident response, and scalability—perfect for Linux, PBX, and mail infrastructure.
What’s inside
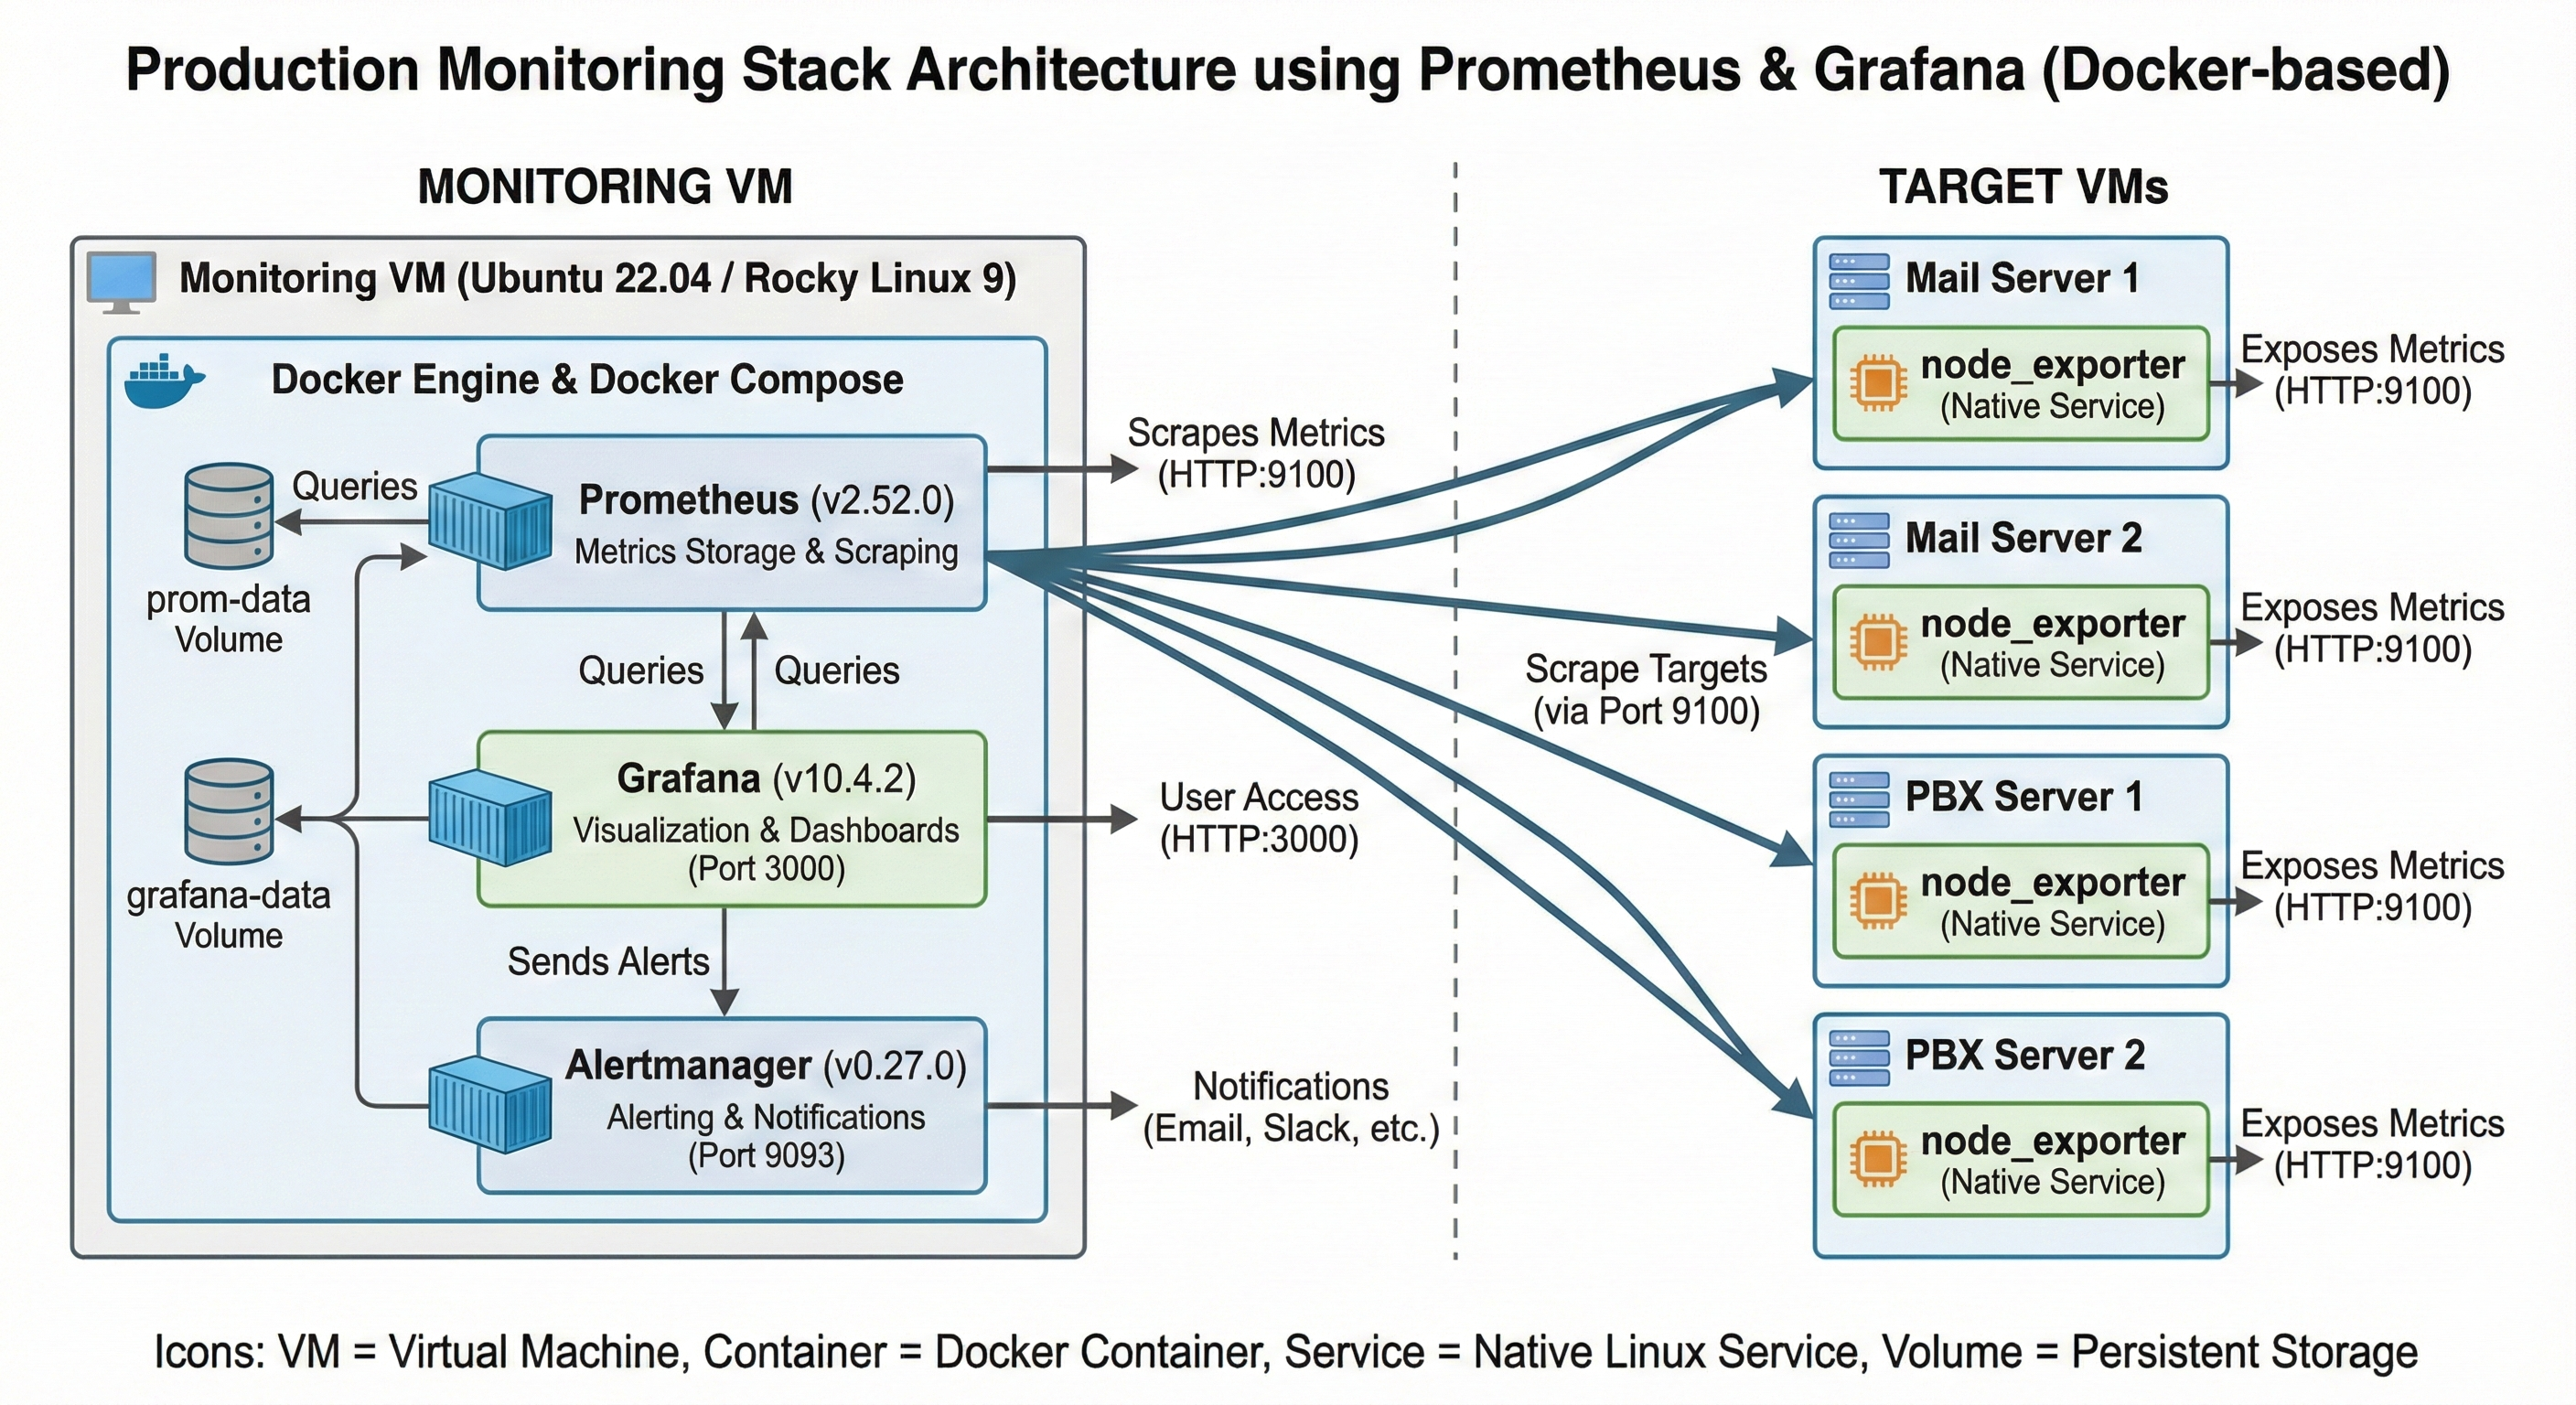
- Central monitoring VM (Dockerized)
- Prometheus for metrics
- Grafana for visualization
- Alertmanager for real-time alerts
- node_exporter on each target server
Monitored metrics
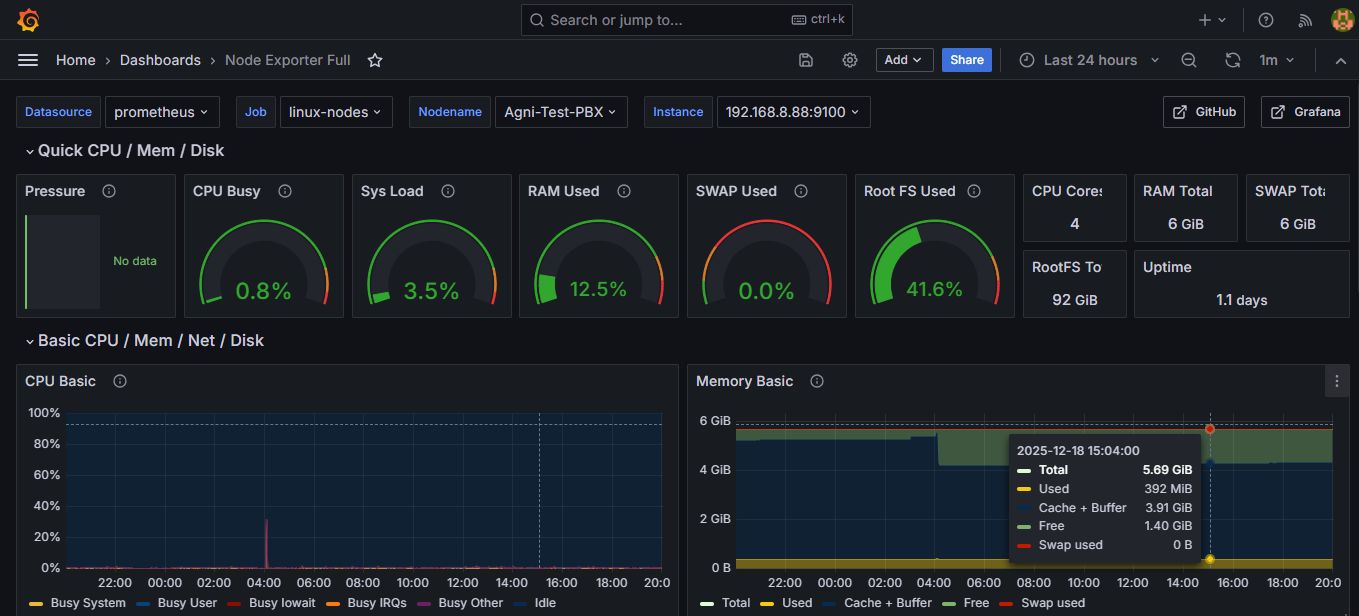
- CPU, Memory, Disk, Network
- PBX & Mail server health
- Server availability & exporter status
Alerts configured
- Disk usage > 90%
- Sustained high CPU
- Server down / exporter unreachable
Production-ready touches
- Persistent volumes
- Firewall restrictions
- Secure Grafana access
- Configs versioned in Git